=Japanese yen=
From Wikipedia, the free encyclopedia (Redirected from Yen) Jump to: navigation, search"Yen" redirects here. For other uses, see Yen (disambiguation)."JPY" redirects here. For the Australian pop singer, see John Paul Young.
| Japanese yen | |||||
|---|---|---|---|---|---|
| |||||
| ISO 4217 code | JPY | ||||
| User(s) | Japan | ||||
| Inflation | 0.0% Feb. 2011 | ||||
| Source | The Statistics Bureau and the Director-General for Policy Planning, 2010 Feb. est. | ||||
| Subunit | |||||
| 1/100 | sen | ||||
| 1/1000 | rin | ||||
| Plural | The language(s) of this currency does not have a morphological plural distinction. | ||||
| Coins | ¥1, ¥5, ¥10, ¥50, ¥100, ¥500 | ||||
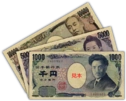
| Banknotes | ¥1000, ¥2000, ¥5000, ¥10,000 | ||||
| Central bank | Bank of Japan | ||||
| Website | www.boj.or.jp | ||||
| Printer | National Printing Bureau | ||||
| Website | www.npb.go.jp | ||||
| Mint | Japan Mint | ||||
| Website | www.mint.go.jp | ||||
The Japanese yen (円 or 圓 en?) (sign: ¥; code: JPY) is the official currency of Japan. It is the third most traded currency in the foreign exchange market after the United States dollar and the euro.[1] It is also widely used as a reserve currency after the U.S. dollar, the euro and the pound sterling. As is common when counting in East Asia, large quantities of yen are often counted in multiples of 10,000 (man, 万) in the same way as values in Western countries are often quoted in thousands.
[edit] Pronunciation and etymology[]
Yen is pronounced "en" [eɴ] in Japanese. The word (Shinjitai: 円, Traditional Chinese/Kyūjitai: 圓) literally means "round object" in Japanese, as yuán does in Chinese or won in Korean. Originally, Chinese had traded silver in mass (see sycee) and when Spanish and Mexican silver coins arrived, they called them 銀圓 (silver round) for their circular shapes.[2] The coins and the name also appeared in Japan. Later, the Chinese replaced 圓 with 元[3][4] which has the same pronunciation in Mandarin (but not in Japanese). The Japanese preferred 圓 which remains until now (albeit in its simplified form, 円, since the end of World War II).
The spelling and pronunciation "yen" is standard in English. This is because mainly English speakers who visited Japan at the end of the Edo period to the early Meiji period spelled words this way. ゑん/wen/ in historical kana orthography. In the 16th century, Japanese /e/(え) and /we/(ゑ) both had been pronounced [je] and Portuguese missionaries had spelled them "ye".[5] Some time thereafter, by the middle of the 18th century, /e/ and /we/ came to be pronounced [e] as in modern Japanese, although some regions retain the [je] pronunciation. Walter Henry Medhurst, who had not come to Japan and interviewed some Japanese in Batavia (Jakarta), spelled some "e"s as "ye" in his An English and Japanese, and Japanese and English Vocabulary (1830).[6] In the early Meiji era, James Curtis Hepburn, following Medhurst, spelled all "e"s as "ye" in his A Japanese and English dictionary (1st ed.[7] 1867). That was the first full-scale Japanese-English/English-Japanese dictionary, which had a strong influence on Westerners in Japan and probably prompted the spelling "yen". Hepburn revised most of "ye"s to "e" in the 3rd edition (1886)[8] in order to mirror the contemporary pronunciation, except "yen".[9] This was probably already fixed and has remained so ever since.
[edit] History[]
Further information: Japanese currency
| This remainder of the article needs additional citations for verification. Please help improve this article by adding citations to reliable sources. Unsourced material may be challenged and removed. (February 2011) |
[edit] Introduction of the yen[]
Early 1 yen banknote, obverse and reverse.In the 19th century silver Spanish dollar coins were common throughout South east Asia, the China coast, and Japan. These coins had been introduced through Manila over a period of two hundred and fifty years, arriving on ships from Acapulco in Mexico. These ships were known as the Manila galleons. Until the 19th century these silver dollar coins were actual Spanish dollars minted in the new world, mostly at Mexico City. But from the 1840s they were increasingly replaced by silver dollars of the new Latin American republics. In the latter half of the 19th century some local coins in the region were made in the likeness of the Mexican peso. The first of these local silver coins was the Hong Kong silver dollar coin that was minted in Hong Kong between the years 1866 and 1868. The Chinese were slow to accept unfamiliar coinage and preferred the familiar Mexican dollars, and so the Hong Kong government ceased minting these coins and sold the mint machinery to Japan. Early one yen coin (1.5g of pure gold), obverse and reverse.The Japanese then decided to adopt a silver dollar coinage under the name of 'yen', meaning 'a round object'. The yen was officially adopted by the Meiji government in an Act signed on May 10, 1871.[10] The new currency was gradually introduced beginning from July of that year. The yen was therefore basically a dollar unit, like all dollars, descended from the Spanish Pieces of eight, and up until the year 1873, all the dollars in the world had more or less the same value. The yen replaced Tokugawa coinage, a complex monetary system of the Edo period based on the mon. The New Currency Act of 1871 stipulated the adoption of the decimal accounting system of yen (1, 圓), sen (⅟100, 銭), and rin (⅟1000, 厘), with the coins being round and manufactured using Western machinery. The yen was legally defined as 0.78 troy ounces (24.26 g) of pure silver, or 1.5 grams of pure gold (as recommended by the European Congress of Economists in Paris in 1867; the 5-yen coin was equivalent to the Argentine 5 peso fuerte coin[11]), hence putting it on a bimetallic standard. (The same amount of silver is worth about 1181 modern yen,[12] while the same amount of gold is worth about 4715 yen.[13]) Early silver one yen coin, 24.26 grams of pure silver, Japan, minted in 1870 (Year 3 of the Meiji period.Following the silver devaluation of 1873, the yen devalued against the US dollar and the Canadian dollar units since they adhered to a gold standard, and by the year 1897 the yen was worth only about US$0.50. In that year, Japan adopted a gold exchange standard and hence froze the value of the yen at $0.50.[14]
(The sen and the rin were eventually taken out of circulation at the end of 1953.[15])
[edit] Fixed value of the yen to the US dollar[]
The yen lost most of its value during and after World War II. After a period of instability, in 1949, the value of the yen was fixed at ¥360 per US$1 through a United States plan, which was part of the Bretton Woods System, to stabilize prices in the Japanese economy. That exchange rate was maintained until 1971, when the United States abandoned the gold standard, which had been a key element of the Bretton Woods System, and imposed a 10 percent surcharge on imports, setting in motion changes that eventually led to floating exchange rates in 1973. As of 2011, the yen has become much stronger and the USD to JPY ratio is about ¥75 to the dollar.
[edit] Undervalued yen[]
By 1971 the yen had become undervalued. Japanese exports were costing too little in international markets, and imports from abroad were costing the Japanese too much. This undervaluation was reflected in the current account balance, which had risen from the deficits of the early 1960s to a then-large surplus of US$5.8 billion in 1971. The belief that the yen, and several other major currencies, were undervalued motivated the United States' actions in 1971.
[edit] Yen and major currencies float[]
Following the United States' measures to devalue the dollar in the summer of 1971, the Japanese government agreed to a new, fixed exchange rate as part of the Smithsonian Agreement, signed at the end of the year. This agreement set the exchange rate at ¥308 per US$1. However, the new fixed rates of the Smithsonian Agreement were difficult to maintain in the face of supply and demand pressures in the foreign-exchange market. In early 1973, the rates were abandoned, and the major nations of the world allowed their currencies to float.
[edit] Japanese government intervention in the currency market[]
In the 1970s, Japanese government and business people were very concerned that a rise in the value of the yen would hurt export growth by making Japanese products less competitive and would damage the industrial base. The government therefore continued to intervene heavily in foreign-exchange marketing (buying or selling dollars), even after the 1973 decision to allow the yen to float.
Despite intervention, market pressures caused the yen to continue climbing in value, peaking temporarily at an average of ¥271 per US$1 in 1973 before the impact of the 1973 oil crisis was felt. The increased costs of imported oil caused the yen to depreciate to a range of ¥290 to ¥300 between 1974 and 1976. The re-emergence of trade surpluses drove the yen back up to ¥211 in 1978. This currency strengthening was again reversed by the second oil shock in 1979, with the yen dropping to ¥227 by 1980.
[edit] Yen in the early 1980s[]
During the first half of the 1980s, the yen failed to rise in value even though current account surpluses returned and grew quickly. From ¥221 in 1981, the average value of the yen actually dropped to ¥239 in 1985. The rise in the current account surplus generated stronger demand for yen in foreign-exchange markets, but this trade-related demand for yen was offset by other factors. A wide differential in interest rates, with United States interest rates much higher than those in Japan, and the continuing moves to deregulate the international flow of capital, led to a large net outflow of capital from Japan. This capital flow increased the supply of yen in foreign-exchange markets, as Japanese investors changed their yen for other currencies (mainly dollars) to invest overseas. This kept the yen weak relative to the dollar and fostered the rapid rise in the Japanese trade surplus that took place in the 1980s.
[edit] Effect of the Plaza Accord[]
JPY Nominal and Real effective exchange rates (2005 = 100)In 1985 a dramatic change began. Finance officials from major nations signed an agreement (the Plaza Accord) affirming that the dollar was overvalued (and, therefore, the yen undervalued). This agreement, and shifting supply and demand pressures in the markets, led to a rapid rise in the value of the yen. From its average of ¥239 per US$1 in 1985, the yen rose to a peak of ¥128 in 1988, virtually doubling its value relative to the dollar. After declining somewhat in 1989 and 1990, it reached a new high of ¥123 to US$1 in December 1992. In April 1995, the yen hit a peak of under 80 yen per dollar, temporarily making Japan's economy nearly the size of the US.[16]
[edit] Post-bubble years[]
The yen declined during the Japanese asset price bubble and continued to do so afterwards, reaching a low of ¥134 to US$1 in February 2002. The Bank of Japan's policy of zero interest rates has discouraged yen investments, with the carry trade of investors borrowing yen and investing in better-paying currencies (thus further pushing down the yen) estimated to be as large as $1 trillion.[17] In February 2007 The Economist estimated that the yen was 15% undervalued against the dollar, and as much as 40% undervalued against the euro.[18]
[edit] After the global economic crisis of 2008[]
Comparison of the GNP-weighted nominal exchange rates: CHF and JPY versus CNY, EUR, USD, and GBPHowever, this trend of depreciation reversed after the global economic crisis of 2008. Other major currencies except the Swiss franc have been declining relative to the yen.
[edit] Coins[]
Early 20 yen gold coin.Coins were introduced in 1870. There were silver 5, 10, 20 and 50 sen and 1 yen, and gold 2, 5, 10 and 20 yen. Gold 1 yen were introduced in 1871, followed by copper 1 rin, ½, 1 and 2 sen in 1873.
Cupronickel 5 sen coins were introduced in 1889. In 1897, the silver 1 yen coin was demonetized and the sizes of the gold coins were reduced by 50%, with 5, 10 and 20 yen coins issued. In 1920, cupro-nickel 10 sen coins were introduced. Early 1 yen silver coin, 26.96 grams of .900 pure silver, Japan, minted in 1901 (Year 34 of the Meiji period).Production of silver coins ceased in 1938, after which a variety of base metals were used to produce 1, 5 and 10 sen coins during the Second World War. Clay 5 and 10 sen coins were produced in 1945 but not issued for circulation. Japanese 10 yen coin (obverse) showing Phoenix Hall of Byōdō-inAfter the war, brass 50 sen, 1 and 5 yen were introduced between 1946 and 1948. In 1949, the current type of holed 5 yen was introduced, followed by bronze 10 yen (of the type still in circulation) in 1951.
Coins in denominations of less than 1 yen became invalid on December 31, 1953, following enforcement of the Small Currency Disposition and Fractional Rounding in Payments Act (小額通貨の整理及び支払金の端数計算に関する法律 Shōgaku tsūka no seiri oyobi shiharaikin no hasūkeisan ni kan suru hōritsu?).
In 1955 the current type of aluminium 1 yen was introduced, along with unholed, nickel 50 yen. In 1957, silver 100 yen pieces were introduced. These were replaced in 1967 by the current, cupro-nickel type, along with the holed 50 yen coin. In 1982 the first 500 yen coins were introduced.[19]
The date (expressed as the year in the reign of the emperor at the time the coin was stamped) is on the reverse of all coins, and, in most cases, country name (through 1945, 大日本 or Dai Nippon, "Great Japan"; after 1945, 日本国, Nihon koku, "State of Japan") and the value in kanji is on the obverse, except for the present 5-yen coin where the country name is on the reverse.
As of April 2011[update] the 500 yen coin was the highest-valued coin to be used regularly in the world (depending on exchange rates, the rarely-used 5 Cuban convertible peso coin is sometimes the highest-valued), with value of over US$6. Because of this high face value, the 500 yen has been a favorite target for counterfeiters; it was counterfeited to such an extent that in 2000 a new series of coins was issued with various security features, but counterfeiting continued.[citation needed]
The 1 yen coin is made out of 100% aluminum and can float on water if placed correctly.
On various occasions, commemorative coins are minted, often using gold and silver with face values as high as 100,000 yen.[20] The first of these were silver ¥100 and ¥1000 Summer Olympic coins issued for the 1964 games. Recently this practice is undertaken with the 500 yen coin, first in commemoration of the Nagano Olympic games in 1998, and then the Aichi Expo in 2005. The current commemorative 500 and 1000 yen coin series began circulation in December, 2009, with 47 unique designs for each with only one available from banks in each prefecture. 100000 of each have been minted and they are all currently (as of October, 2010) still available in major banks at face value. Someone collecting one of each coin would need to invest 70500 yen, thus creating a major source of income for the Japanese government. Even though all commemorative coins can be used, they are not seen often in typical daily use and normally do not circulate.
Instead of displaying the CE year of mintage like most nations' coins, yen coins instead display the year of the current emperor's reign. For example, a coin minted in 2009 would bear the date Heisei 21 (the 21st year of Emperor Akihito's reign).[21]
| Currently circulating coins[22] | |||||||||
|---|---|---|---|---|---|---|---|---|---|
| Image | Value | Technical parameters | Description | Date of first minting | |||||
| Diameter | Thickness | Mass | Composition | Edge | Obverse | Reverse | |||
| ¥1 | 20 mm | 1.2 mm | 1 g | 100% aluminium | Smooth | Young tree, state title, value | Value, year of minting | 1955 | |
| ¥5 | 22 mm | 1.5 mm | 3.75 g | 60–70% copper30–40% zinc | Smooth | Ear of Rice, gear, water, value | State title, year of minting | 1959 | |
| ¥10 | 23.5 mm | 1.5 mm | 4.5 g | 95% copper3–4% zinc
1–2% tin |
Reeded | Hōōdō Temple, Byōdō-in, state title, value | Evergreen tree, value, year of minting | 1951 | |
| Smooth | 1959 | ||||||||
| ¥50 | 21 mm | 1.7 mm | 4 g | Cupronickel75% copper
25% nickel |
Reeded | Chrysanthemum, state title, value | Value, year of minting | 1967 | |
| ¥100 | 22.6 mm | 1.7 mm | 4.8 g | Cupronickel75% copper
25% nickel |
Reeded | Cherry blossoms, state title, value | Value, year of minting | 1967 | |
| ¥500 | 26.5 mm | 2 mm | 7.2 g | Cupronickel75% copper
25% nickel |
Smooth with lettering ("NIPPON ◆ 500 ◆ NIPPON ◆ 500 ◆") | Paulownia, state title, value | Value, bamboo, Mandarin orange, year of minting | 1982 (no longer in mintage, limited circulation) | |
| 7 g | 72% copper20% zinc
8% nickel |
Reeded slantingly | Value, bamboo, Mandarin orange, year of minting, latent image[23] | 2000 | |||||
| These images are to scale at 2.5 pixels per millimeter. For table standards, see the coin specification table. | |||||||||
Due to the great differences in style, size, weight and the pattern present on the edge of the coin they are very easy for people with visual impairments to tell apart from one another.
| Unholed | Holed | |
|---|---|---|
| Smooth edge | ¥1 (light) ¥10 (medium) |
¥5 |
| Reeded edge | ¥100 (medium) ¥500 (heavy) |
¥50 |
[edit] Banknotes[]
A Series D 2000 yen note, featuring ShureimonMain article: Banknotes of the Japanese yenThe issuance of the yen banknotes began in 1872, two years after the currency was introduced. Throughout its history, the denominations have ranged from 10 yen to 10000 yen.
Before and during World War II, various bodies issued banknotes in yen, such as the Ministry of Finance and the Imperial Japanese National Bank. The Allied forces also issued some notes shortly after the war. Since then, the Bank of Japan has been the exclusive note issuing authority. The bank has issued five series after World War II. Series E, the current series, consists of ¥1000, ¥2000, ¥5000, and ¥10,000. The ¥2000 bills are rare these days, and often not accepted as a means of payment, not even in dispensing machines.
[edit] Determinants of value[]
| Rank | Currency | ISO 4217 code (Symbol) |
% daily share (April 2010) |
|---|---|---|---|
| 1 | United States dollar | USD ($) | 84.9% |
| 2 | Euro | EUR (€) | 39.1% |
| 3 | Japanese yen | JPY (¥) | 19.0% |
| 4 | Pound sterling | GBP (£) | 12.9% |
| 5 | Australian dollar | AUD ($) | 7.6% |
| 6 | Swiss franc | CHF (Fr) | 6.4% |
| 7 | Canadian dollar | CAD ($) | 5.3% |
| 8 | Hong Kong dollar | HKD ($) | 2.4% |
| 9 | Swedish krona | SEK (kr) | 2.2% |
| 10 | New Zealand dollar | NZD ($) | 1.6% |
| 11 | South Korean won | KRW (₩) | 1.5% |
| 12 | Singapore dollar | SGD ($) | 1.4% |
| 13 | Norwegian krone | NOK (kr) | 1.3% |
| 14 | Mexican peso | MXN ($) | 1.3% |
| 15 | Indian rupee | INR () | 0.9% |
| Other | 12.2% | ||
| Total[25] | 200% | ||
Beginning in December 1931, Japan gradually shifted from the gold standard system to the managed currency system.[26]
The relative value of the yen is determined in foreign exchange markets by the economic forces of supply and demand. The supply of the yen in the market is governed by the desire of yen holders to exchange their yen for other currencies to purchase goods, services, or assets. The demand for the yen is governed by the desire of foreigners to buy goods and services in Japan and by their interest in investing in Japan (buying yen-denominated real and financial assets).
Since the 1990s, the Bank of Japan, the country's central bank, has kept interest rates low in order to spur economic growth. Short-term lending rates have responded to this monetary relaxation and fell from 3.7% to 1.3% between 1993 and 2008.[27] Low interest rates combined with a ready liquidity for the yen prompted investors to borrow money in Japan and invest it in other countries (a practice known as carry trade). This has helped to keep the value of the yen low compared to other currencies.
[edit] International reserve currency[]
Main article: Reserve currency
*v
|
'95 | '96 | '97 | '98 | '99 | '00 | '01 | '02 | '03 | '04 | '05 | '06 | '07 | '08 | '09 | '10 | Latest Data '11 Quarter II |
|---|---|---|---|---|---|---|---|---|---|---|---|---|---|---|---|---|---|
| US dollar | 59.0% | 62.1% | 65.2% | 69.3% | 70.9% | 70.5% | 70.7% | 66.5% | 65.8% | 65.9% | 66.4% | 65.7% | 64.1% | 64.1% | 62.1% | 61.8% | 60.2% |
| Euro | 17.9% | 18.8% | 19.8% | 24.2% | 25.3% | 24.9% | 24.3% | 25.2% | 26.3% | 26.4% | 27.6% | 25.9% | 26.7% | ||||
| German mark | 15.8% | 14.7% | 14.5% | 13.8% | |||||||||||||
| French franc | 2.4% | 1.8% | 1.4% | 1.6% | |||||||||||||
| Pound sterling | 2.1% | 2.7% | 2.6% | 2.7% | 2.9% | 2.8% | 2.7% | 2.9% | 2.6% | 3.3% | 3.6% | 4.2% | 4.7% | 4.0% | 4.3% | 4.0% | 4.2% |
| Japanese yen | 6.8% | 6.7% | 5.8% | 6.2% | 6.4% | 6.3% | 5.2% | 4.5% | 4.1% | 3.9% | 3.7% | 3.2% | 2.9% | 3.1% | 2.9% | 3.8% | 3.9% |
| Swiss franc | 0.3% | 0.2% | 0.4% | 0.3% | 0.2% | 0.3% | 0.3% | 0.4% | 0.2% | 0.2% | 0.1% | 0.2% | 0.2% | 0.1% | 0.1% | 0.1% | 0.1% |
| Other | 13.6% | 11.7% | 10.2% | 6.1% | 1.6% | 1.4% | 1.2% | 1.4% | 1.9% | 1.8% | 1.9% | 1.5% | 1.8% | 2.2% | 3.1% | 4.5% | 4.9% |
| Sources: 1995-1999, 2006-2010 IMF: Currency Composition of Official Foreign Exchange ReservesSources: 1999-2005 ECB: The Accumulation of Foreign Reserves | |||||||||||||||||
[edit] SDR basket[]
The Special Drawing Rights (SDR) valuation is an IMF basket of currencies, including the Japanese yen. The SDR is linked to a basket of currencies with 41.9% for the dollar, 37.4% for the euro, 11.3% for the pound sterling, and 9.4% for the yen (as of 2011).[28] The percentage for the yen has however declined from 18% in 2000. The exchange rate for the Japanese yen is expressed in terms of currency units per U.S. dollar; other rates are expressed as U.S. dollars per currency unit. The SDR currency value is calculated daily and the valuation basket is reviewed and adjusted every five years. The SDR was created in 1969 to support the fixed exchange system.
[edit] Historical exchange rate[]
The table below shows the number of yen per U.S. dollar (monthly average).[29][30]
| Year | Month | |||||||||||
|---|---|---|---|---|---|---|---|---|---|---|---|---|
| Jan | Feb | Mar | Apr | May | Jun | Jul | Aug | Sep | Oct | Nov | Dec | |
| 1949–71 | 360 | |||||||||||
| 1972 | 308 | |||||||||||
| 1973 | 301.15 | 270.00 | 265.83 | 265.50 | 264.95 | 265.30 | 263.45 | 265.30 | 265.70 | 266.68 | 279.00 | 280.00 |
| 1974 | 299.00 | 287.60 | 276.00 | 279.75 | 281.90 | 284.10 | 297.80 | 302.70 | 298.50 | 299.85 | 300.10 | 300.95 |
| 1975 | 297.85 | 286.60 | 293.80 | 293.30 | 291.35 | 296.35 | 297.35 | 297.90 | 302.70 | 301.80 | 303.00 | 305.15 |
| 1976 | 303.70 | 302.25 | 299.70 | 299.40 | 299.95 | 297.40 | 293.40 | 288.76 | 287.30 | 293.70 | 296.45 | 293.00 |
| 1977 | 288.25 | 283.25 | 277.30 | 277.50 | 277.30 | 266.50 | 266.30 | 267.43 | 264.50 | 250.65 | 244.20 | 240.00 |
| 1978 | 241.74 | 238.83 | 223.40 | 223.90 | 223.15 | 204.50 | 190.80 | 190.00 | 189.15 | 176.05 | 197.80 | 195.10 |
| 1979 | 201.40 | 202.35 | 209.30 | 219.15 | 219.70 | 217.00 | 216.90 | 220.05 | 223.45 | 237.80 | 249.50 | 239.90 |
| 1980 | 237.73 | 244.07 | 248.61 | 251.45 | 228.06 | 218.11 | 220.91 | 224.34 | 214.95 | 209.21 | 212.99 | 209.79 |
| 1981 | 202.19 | 205.76 | 208.84 | 215.07 | 220.78 | 224.21 | 232.11 | 233.62 | 229.83 | 231.40 | 223.76 | 219.02 |
| 1982 | 224.55 | 235.25 | 240.64 | 244.90 | 236.97 | 251.11 | 255.10 | 258.67 | 262.74 | 271.33 | 265.02 | 242.49 |
| 1983 | 232.90 | 236.27 | 237.92 | 237.70 | 234.78 | 240.06 | 240.49 | 244.36 | 242.71 | 233.00 | 235.25 | 234.34 |
| 1984 | 233.95 | 233.67 | 225.52 | 224.95 | 230.67 | 233.29 | 242.72 | 242.24 | 245.19 | 246.89 | 243.29 | 247.96 |
| 1985 | 254.11 | 260.34 | 258.43 | 251.67 | 251.57 | 248.95 | 241.70 | 237.20 | 236.91 | 214.84 | 203.85 | 202.75 |
| 1986 | 200.05 | 184.62 | 178.83 | 175.56 | 166.89 | 167.82 | 158.65 | 154.11 | 154.78 | 156.04 | 162.72 | 162.13 |
| 1987 | 154.48 | 153.49 | 151.56 | 142.96 | 140.47 | 144.52 | 150.20 | 147.57 | 143.03 | 143.48 | 135.25 | 128.25 |
| 1988 | 127.44 | 129.26 | 127.23 | 124.88 | 124.74 | 127.20 | 133.10 | 133.63 | 134.45 | 128.85 | 123.16 | 123.63 |
| 1989 | 127.24 | 127.77 | 130.35 | 132.01 | 138.40 | 143.92 | 140.63 | 141.20 | 145.06 | 141.99 | 143.55 | 143.62 |
| 1990 | 145.09 | 145.54 | 153.19 | 158.50 | 153.52 | 153.78 | 149.23 | 147.46 | 138.96 | 129.73 | 129.01 | 133.72 |
| 1991 | 133.65 | 130.44 | 137.09 | 137.15 | 138.02 | 139.83 | 137.98 | 136.85 | 134.59 | 130.81 | 129.64 | 128.07 |
| 1992 | 125.05 | 127.53 | 132.75 | 133.59 | 130.55 | 126.90 | 125.66 | 126.34 | 122.72 | 121.14 | 123.84 | 123.98 |
| 1993 | 125.02 | 120.97 | 117.02 | 112.37 | 110.23 | 107.29 | 107.77 | 103.72 | 105.27 | 106.94 | 107.81 | 109.72 |
| 1994 | 111.49 | 106.14 | 105.12 | 103.48 | 104.00 | 102.69 | 98.54 | 99.86 | 98.79 | 98.40 | 98.00 | 100.17 |
| 1995 | 99.79 | 98.23 | 90.77 | 83.53 | 85.21 | 84.54 | 87.24 | 94.56 | 100.31 | 100.68 | 101.89 | 101.86 |
| 1996 | 105.81 | 105.70 | 105.85 | 107.40 | 106.49 | 108.82 | 109.25 | 107.84 | 109.76 | 112.30 | 112.27 | 113.74 |
| 1997 | 118.18 | 123.01 | 122.66 | 125.47 | 118.91 | 114.31 | 115.10 | 117.89 | 120.74 | 121.13 | 125.35 | 129.52 |
| 1998 | 129.45 | 125.85 | 128.83 | 131.81 | 135.08 | 140.35 | 140.66 | 144.76 | 134.50 | 121.33 | 120.61 | 117.40 |
| 1999 | 113.14 | 116.73 | 119.71 | 119.66 | 122.14 | 120.81 | 119.76 | 113.30 | 107.45 | 106.00 | 104.83 | 102.61 |
| 2000 | 105.21 | 109.34 | 106.62 | 105.35 | 108.13 | 106.13 | 107.90 | 108.02 | 106.75 | 108.34 | 108.87 | 112.21 |
| 2001 | 117.10 | 116.10 | 121.21 | 123.77 | 121.83 | 122.19 | 124.63 | 121.53 | 118.91 | 121.32 | 122.33 | 127.32 |
| 2002 | 132.66 | 133.53 | 131.15 | 131.01 | 126.39 | 123.44 | 118.08 | 119.03 | 120.49 | 123.88 | 121.54 | 122.17 |
| 2003 | 118.67 | 119.29 | 118.49 | 119.82 | 117.26 | 118.27 | 118.65 | 118.81 | 115.09 | 109.58 | 109.18 | 107.87 |
| 2004 | 106.39 | 106.54 | 108.57 | 107.31 | 112.27 | 109.45 | 109.34 | 110.41 | 110.05 | 108.90 | 104.86 | 103.82 |
| 2005 | 103.27 | 104.84 | 105.30 | 107.35 | 106.94 | 108.62 | 111.94 | 110.65 | 111.03 | 114.84 | 118.45 | 118.60 |
| 2006 | 115.33 | 117.81 | 117.31 | 117.13 | 111.53 | 114.57 | 115.59 | 115.86 | 117.02 | 118.59 | 117.33 | 117.26 |
| 2007 | 120.59 | 120.49 | 117.29 | 118.81 | 120.77 | 122.64 | 121.56 | 116.74 | 115.01 | 115.77 | 111.24 | 112.28 |
| 2008 | 107.60 | 107.18 | 100.83 | 102.41 | 104.11 | 106.86 | 106.76 | 109.24 | 106.71 | 100.20 | 96.89 | 91.21 |
| 2009 | 90.35 | 92.53 | 97.83 | 98.92 | 96.43 | 96.58 | 94.49 | 94.90 | 91.40 | 90.28 | 89.11 | 89.52 |
| 2010 | 91.26 | 90.28 | 90.56 | 93.43 | 91.79 | 90.89 | 87.67 | 85.44 | 84.31 | 81.80 | 82.43 | 83.38 |
| 2011 | 82.63 | 82.52 | 81.82 | 83.34 | 81.23 | 80.49 | 79.44 | 77.09 | 76.89 | 76.69 | ||
| Year | Jan | Feb | Mar | Apr | May | Jun | Jul | Aug | Sep | Oct | Nov | Dec |
| Month | ||||||||||||
| JPY/USD exchange rate since 1950 | JPY/USD exchange rate since the Heisei era | JPY/CAD exchange rate |
| JPY/EUR exchange rate | JPY/GBP exchange rate | JPY/CHF exchange rate |
| JPY/AUD exchange rate | JPY/NZD exchange rate | JPY/ZAR exchange rate |
| JPY/CNY exchange rate | KRW/JPY exchange rate | JPY/INR exchange rate |
| Current JPY exchange rates | |
|---|---|
| From Google Finance: | AUD CAD CHF EUR GBP HKD USD CNY KRW |
| From Yahoo! Finance: | AUD CAD CHF EUR GBP HKD USD CNY KRW |
| From OzForex: | AUD CAD CHF EUR GBP HKD USD CNY KRW |
| From XE.com: | AUD CAD CHF EUR GBP HKD USD CNY KRW |
| From OANDA.com: | AUD CAD CHF EUR GBP HKD USD CNY KRW |
[edit] See also[]
- Japan Mint
- Japanese military yen
- Economy of Japan
- Capital flows in Japan
- Monetary and fiscal policy of Japan
- Balance of payments accounts of Japan (1960–90)
[edit] Older currency[]
- Japanese mon (currency)
- Koban (coin)
- Ryō (Japanese coin)
- Wadōkaichin
[edit] Notes[]
- ^ [1]
- ^ Mikami Ryuzo, an article about the yen in Sekai Daihyakka Jiten, Kato Shuichi(ed.), Vol. 3, Tokyo: Heibonsha, 2007.
- ^ 元 is not a simplified form of 圓, but a completely different character. 元 means “source” or “origin”. One of the reasons for replacements is said to be that the previous character had too many strokes. Mikami op. cit.
- ^ In 1695 Japan, certain coins were issued whose surface has the character 元 (gen). This is not a unit of money but abbreviation of 元禄(Genroku). See jp:元禄丁銀.
- ^ It is known that in ancient Japanese there were distinct syllables /e/ /we/ /ye/. From middle of 10th century, /e/(え) had merged with /ye/, and both were pronounced [je], while a kana for /ye/ had disappeared. Around the 13th century, /we/(ゑ) and /e/ ceased to be distinguished (in pronunciation, but not in writing system) and both came to be pronounced [je]. S. Hashimoto "Kokugo-on'in no hensen," Kokugo-on'in no kenkyu Tokyo: Iwanami Shoten, 1950.
- ^ Medhurst, Walter Henry. (1830). Current inflation is at 5% An English and Japanese, and Japanese and English Vocabulary: Compiled from Native Works, p. 296.
- ^ Hepburn, James Curtis. (1867). A Japanese and English Dictionary,
- ^ Hepburn, James Curtis. All editions here
- ^ http://www.meijigakuin.ac.jp/mgda/index5_j.html
- ^ A. Piatt Andrew, Quarterly Journal of Economics, "The End of the Mexican Dollar",18:3:321-356, 1904, p.345
- ^ (Spanish) Historia de la moneda
- ^ xe.com (2006-09-07). "Equivalent of 0.78 troy ounce of silver in yen". http://www.xe.com/ucc/convert.cgi?Amount=0.78&From=XAG&To=JPY. Retrieved 2006-09-07.
- ^ xe.com (2006-09-07). "Equivalent of 0.04822612 troy ounce of gold in yen". http://www.xe.com/ucc/convert.cgi?Amount=0.04822612&From=XAU&To=JPY. Retrieved 2006-09-07.
- ^ [2]
- ^ A law of the abolition of currencies in a small denomination and rounding off a fraction, July 15, 1953 Law No.60 (小額通貨の整理及び支払金の端数計算に関する法律 Shōgakutsūka no seiri oyobi shiharaikin no hasūkeisan ni kansuru hōritsu?))
- ^ Hongo, Jun, "Despite historic highs, yen still a safe haven", Japan Times, 13 September 2011, p. 3.
- ^ "What Keeps Bankers Awake at Night? The Economist (London). February 1, 2007.
- ^ "The Cheap Yen is Dangerous," The Economist (London). February 8, 2007.
- ^ Japan Mint. "Number of Coin Production (calendar year)". Archived from the original on 2006-11-10. http://web.archive.org/web/20061110050643/http://www.mint.go.jp/eng/data/page01-1_e.html. Retrieved 2006-09-07.
- ^ Japan Mint. "Commemorative Coins issued up to now". Archived from the original on 2006-11-09. http://web.archive.org/web/20061109025354/http://www.mint.go.jp/eng/data/page02_e.html. Retrieved 2006-09-07.
- ^ Japan Mint. "Designs of circulating coins". http://www.mint.go.jp/eng/kids/circulating_c.html. Retrieved 2007-12-26.
- ^ http://www.boj.or.jp/en/type/list/yuko/okane.htm
- ^ http://www.mint.go.jp/eng/operations/coin/new500-01.html
- ^ "Report on global foreign exchange market activity in 2010" (PDF). Triennial Central Bank Survey. Basel, Switzerland: Bank for International Settlements. December 2010. p. 12. http://bis.org/publ/rpfxf10t.pdf. Retrieved 2 May 2011.
- ^ The total sum is 200% because each currency trade always involves a currency pair.
- ^ Japan Mint. 2006 "75th anniversary of Japan's shift from gold standard to managed currency system". http://www.mint.go.jp/eng/coin/international/coinset/page22.html 2006. Retrieved 2007-12-26.
- ^ Bank of Japan: "Statistics." 2008.
- ^ IMF Currency Amounts in New Special Drawing Rights (SDR) Basket
- ^ Bank of Japan: "Foreign Exchange Rates."[dead link] 2006.
- ^ Bank of Japan: US.Dollar/Yen Spot Rate at 17:00 in JST, Average in the Month, Tokyo Market for duration January 1980 ~ September 2010. Retrieved October 10, 2010
[edit] Further reading[]
- Medhurst, Walter Henry. (1830). An English and Japanese, and Japanese and English Vocabulary: Compiled from Native Works. Batavia, Dutch East Indies: [s.n.]. OCLC 5452087
- Hepburn, James Curtis. (1867). A Japanese and English Dictionary. Shanghai: American Presbyterian Mission Press. OCLC 32634467
- Titsingh, Isaac. (1834). [Siyun-sai Rin-siyo/Hayashi Gahō, 1652]. Nipon o daï itsi ran; ou, Annales des empereurs du Japon. Paris: Oriental Translation Society of Great Britain and Ireland. OCLC 5850691
This article incorporates public domain material from websites or documents of the Library of Congress Country Studies.
[edit] External links[]
| Wikimedia Commons has media related to: Japanese yen |
- Japanese Yen on Wikinvest
- Japanese currency FAQ in Currency Museum, Bank of Japan
- Money in Japan. A guide while traveling.
- Images of historic and modern Japanese bank notes
- Chart: US-Dollar in Yen) (German)
- Chart: 100 Yen in Euro (German)
| Preceded by: |